
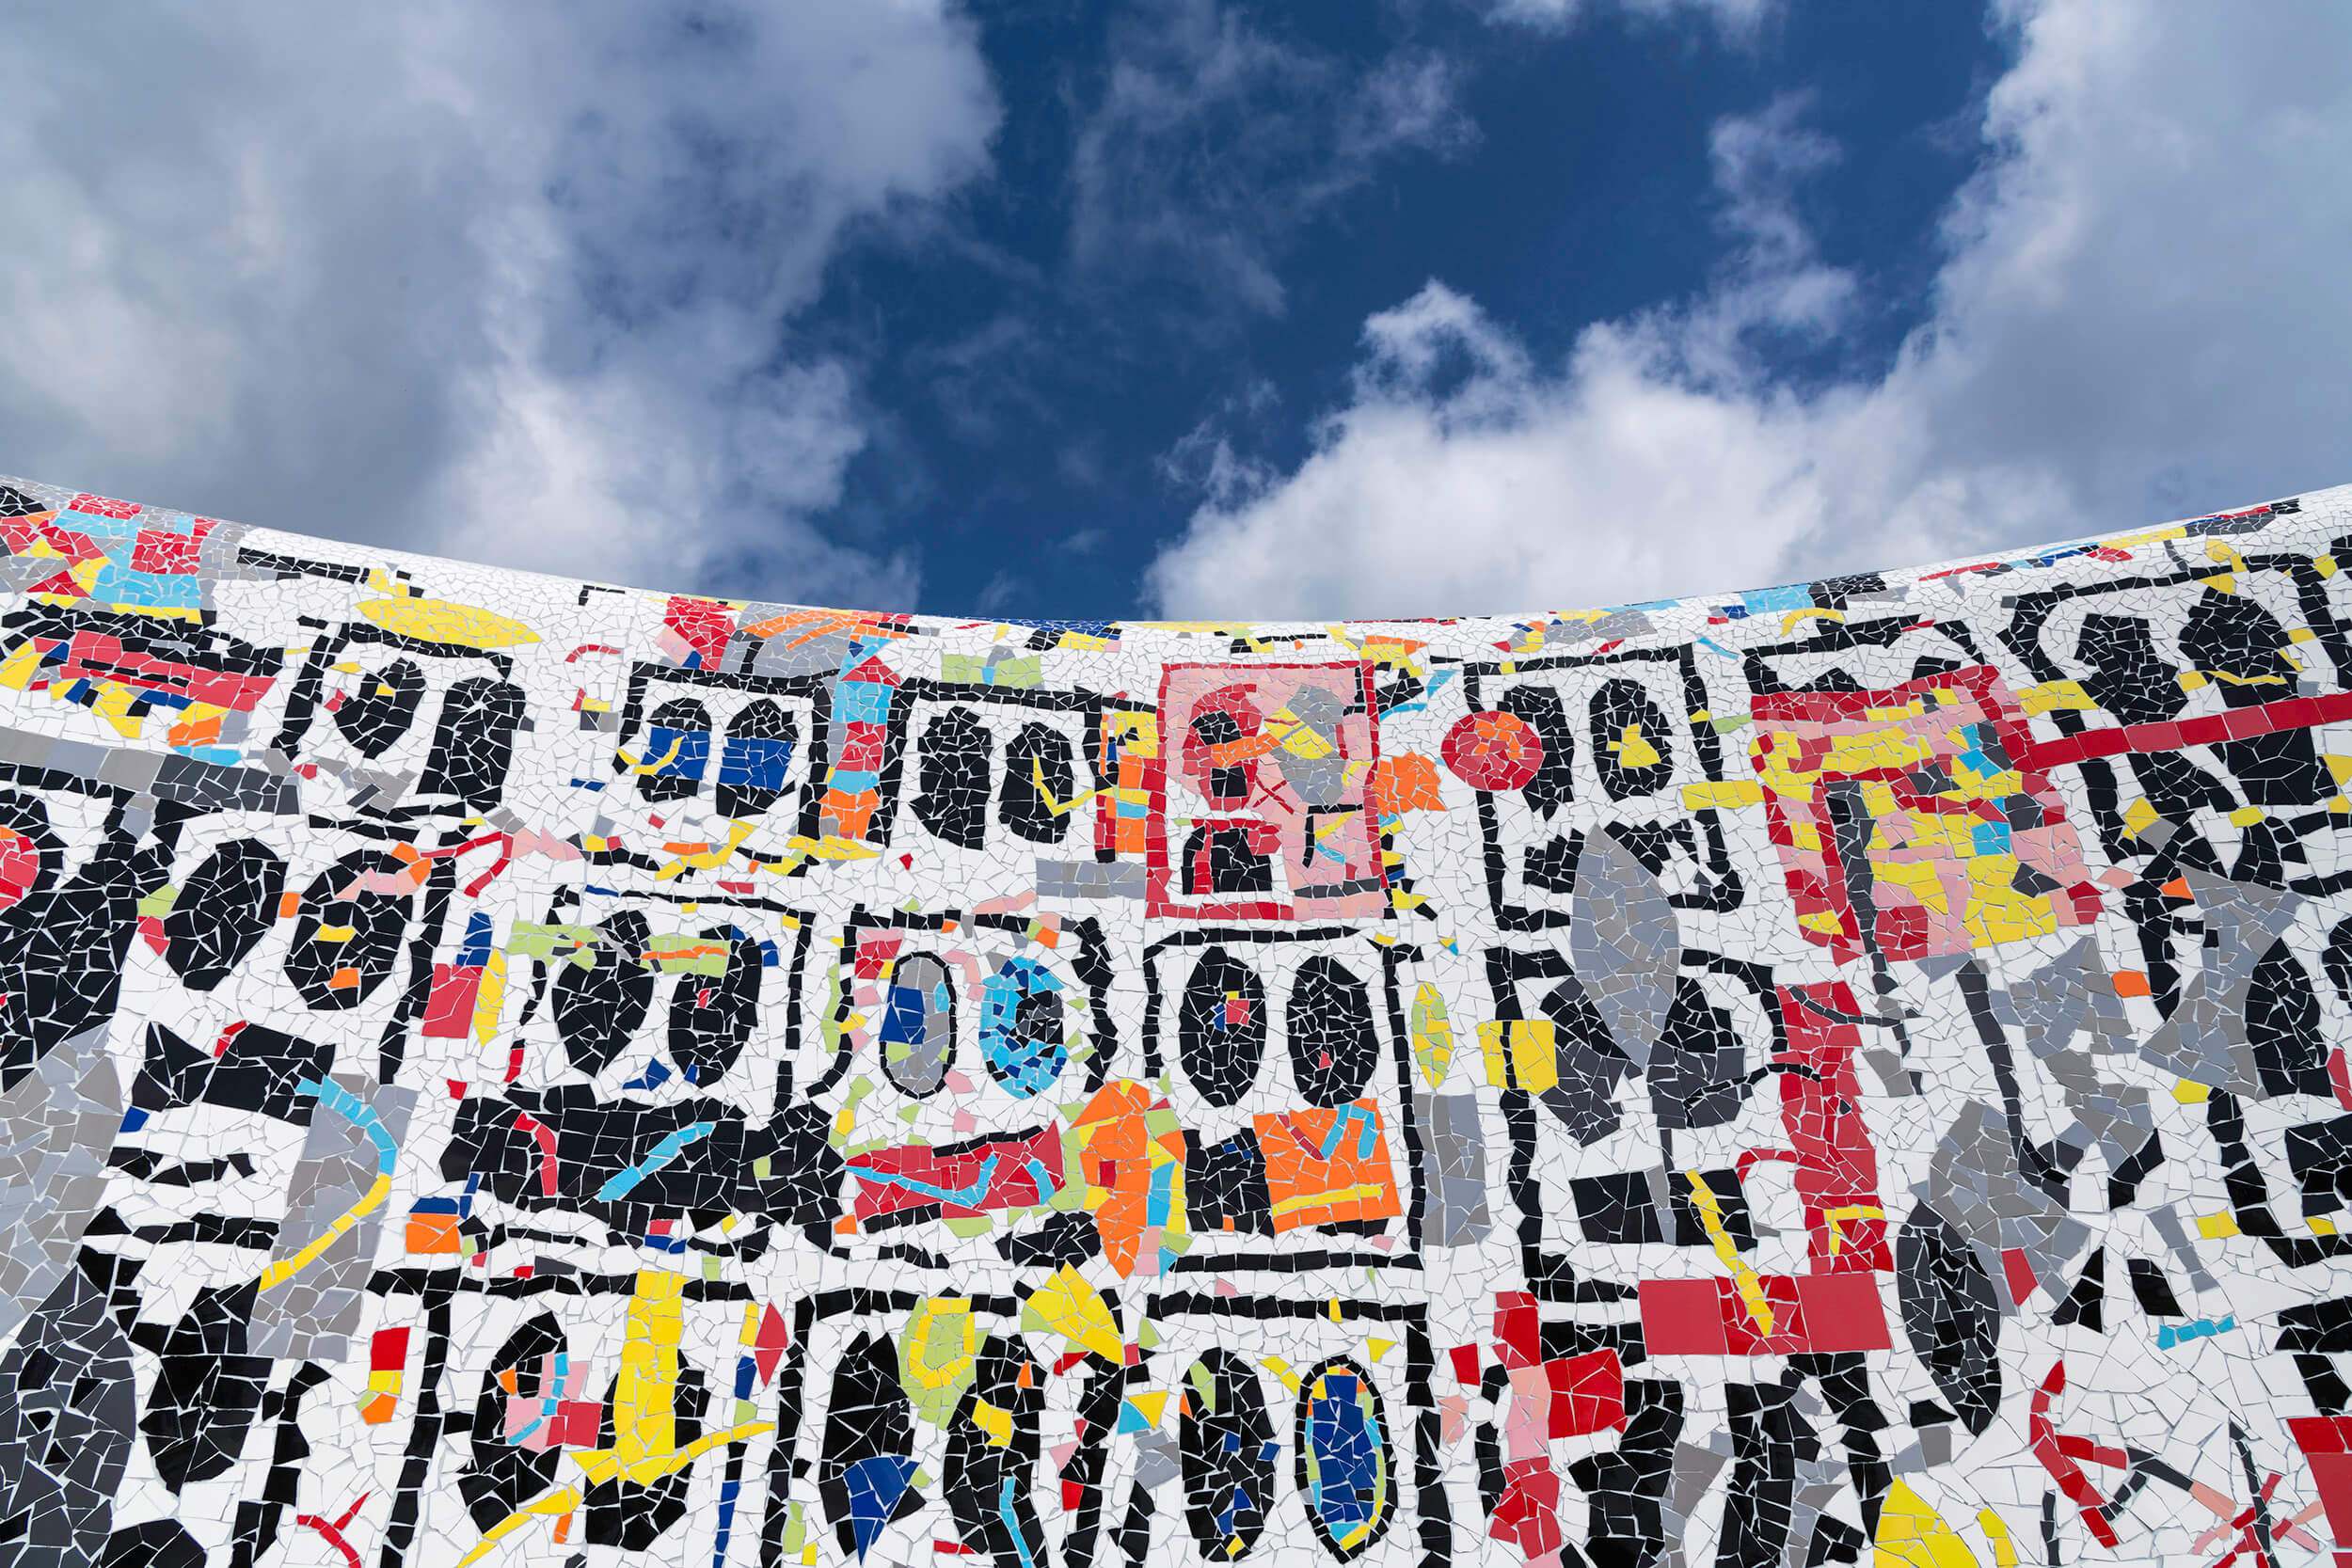
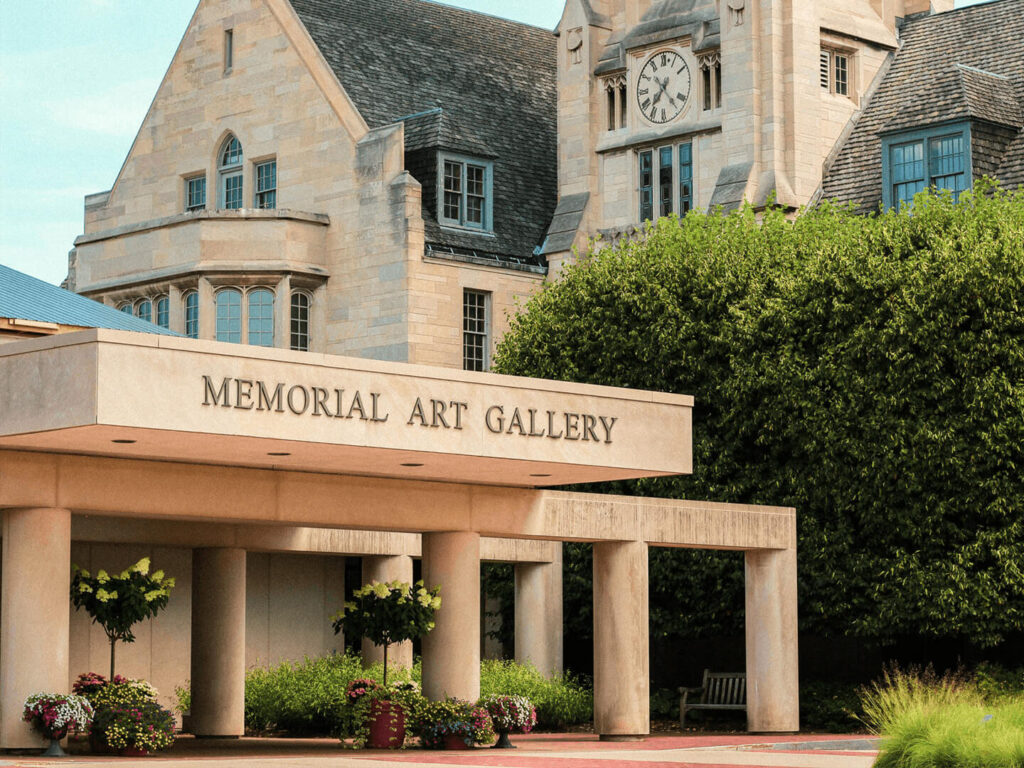
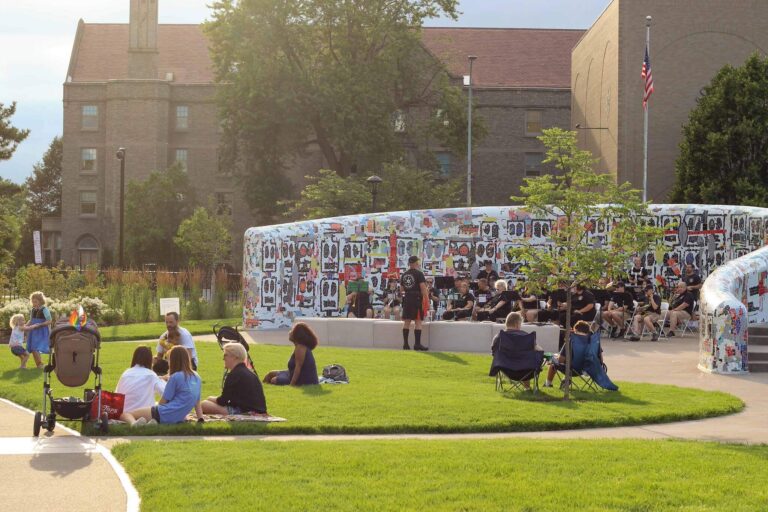
A visit to the Memorial Art Gallery is a journey through more than 5,000 years of art history. From the relics of antiquity to works in the vanguard of contemporary practice, MAG offers a panorama of the world’s art. Our 14-acre campus is a spectacular public art space that is a popular destination for Rochesterians and out-of-town visitors alike.
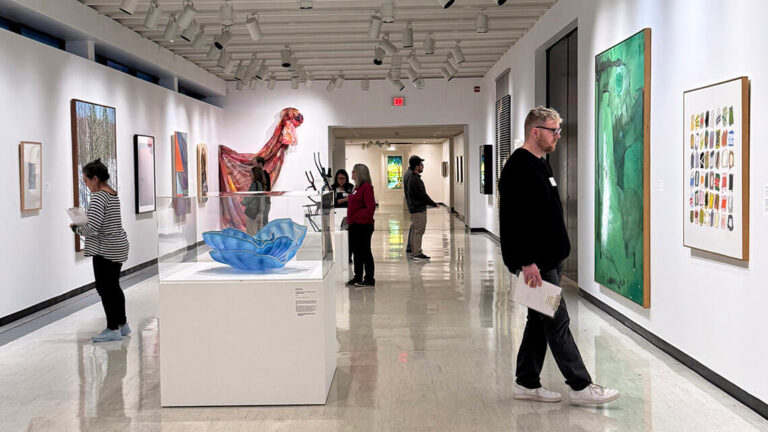
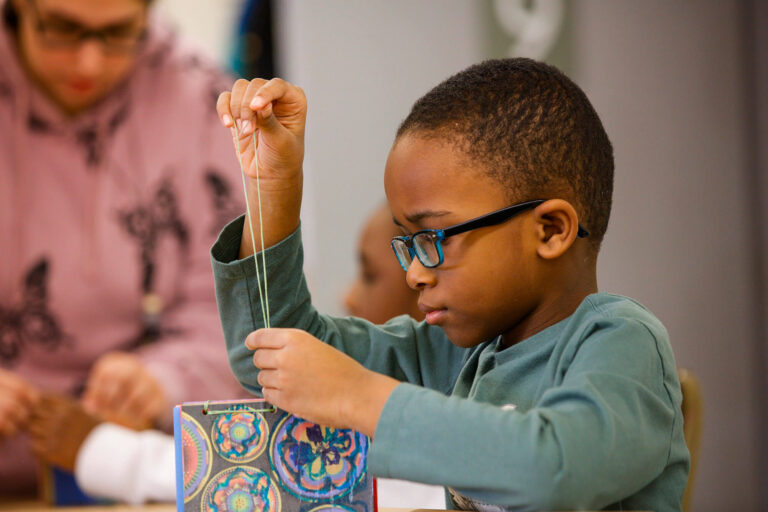
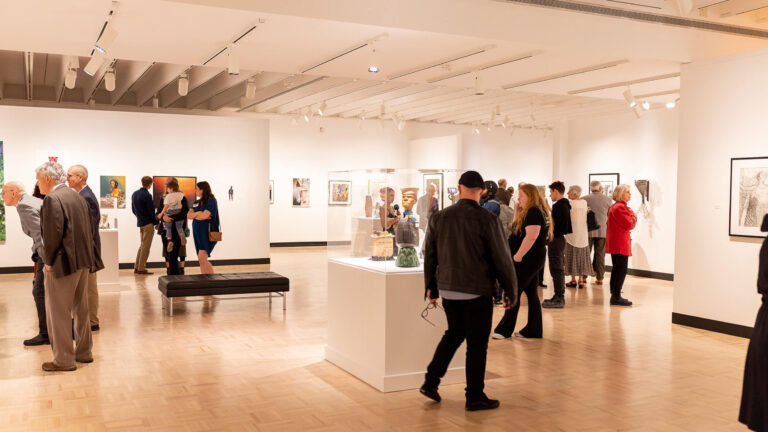
MAG’s permanent collection of more than 13,000 objects has been called “the best balanced in the state outside of metropolitan New York City.” In addition to its collection, the museum offers a year-round schedule of temporary exhibitions, lectures, concerts, tours, and family activities.
Mission Statement
Through art, MAG connects people, inspires fun, and ignites discovery.
Vision
As the center of the conversation on creativity, MAG builds community and enriches the way we see ourselves and the world around us.
Values
MAG stands for: Art and Culture; Learning and Joy; Accessibility and Inspiration; Stewardship and Integrity; and Community and Sociability.

Land Acknowledgement
The Memorial Art Gallery of the University of Rochester sits on the lands of the Haudenosaunee people, specifically the Seneca Nation. These lands were the traditional territory of the Seneca prior to their removal through invasion and occupation, as well as deceptive and broken agreements. The lands continue to serve as home to the native peoples and cultures who have lived here for centuries. Stories of creation, ancestors, spiritual life, and the struggle for survival and identity live today in this land. We honor the rich culture, heritage, and contributions of native peoples, and their stewardship of the land that we now occupy.
We are keenly aware of the role that museums have played in contributing to the struggles faced by Native Americans. As an art museum, we are committed to working toward dismantling the systems of oppression that have impacted the lives of Native Americans both historically and presently. We are committed to working across all facets of our institution to address the long history of the invisibility of Native Americans. We aim to promote the important and myriad contributions to art, culture, and society of Native Americans in order to effect positive change in our community.
More to Explore
The Memorial Art Gallery is supported primarily by its members and the University of Rochester. Additional funding is provided by the New York State Council on the Arts with the support of the Office of the Governor and the New York State Legislature. Half-price Thursday admission is made possible by Monroe County.